> ## Documentation Index
> Fetch the complete documentation index at: https://docs.raily.ai/llms.txt
> Use this file to discover all available pages before exploring further.
# Analytics
> Track content usage, access patterns, and AI system behavior
## Overview
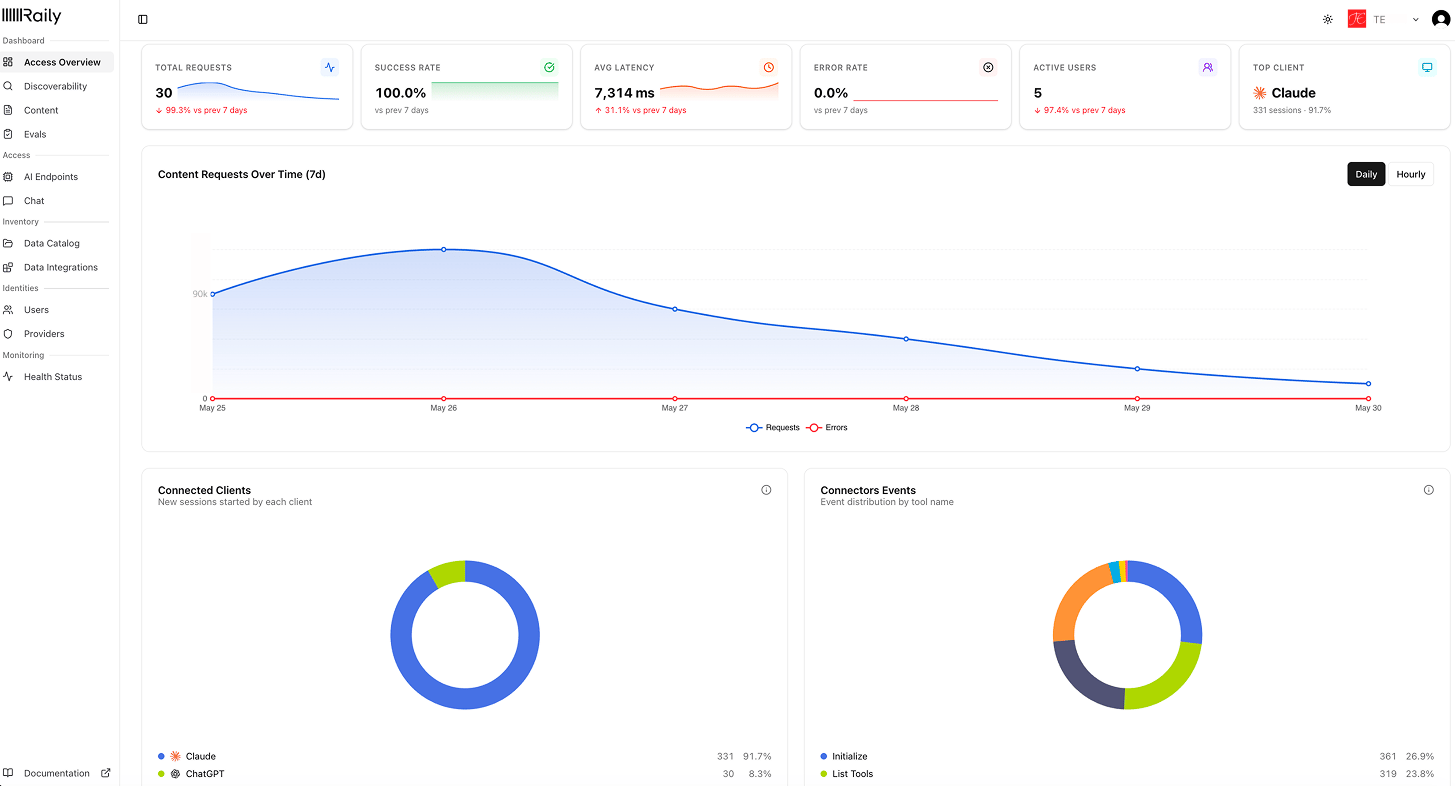
Raily provides analytics to help you understand how your content is being accessed and used by AI systems. Access your analytics through the Raily dashboard at [app.raily.ai/dashboard/access-overview](https://app.raily.ai/dashboard/access-overview).
 ## Available Metrics
### Total Calls
The total number of API calls and content access requests to your content.
### Average Response Time
The average time it takes to process and respond to requests.
### Total Input Tokens
The total number of tokens sent in all requests.
### Total Output Tokens
The total number of tokens returned in all responses.
### Average Input Tokens
The average number of input tokens per request.
### Average Output Tokens
The average number of output tokens per response.
### Content and Resources Access Over Time
A timeline chart showing how your content and resources are accessed over time.
## Next Steps
Configure access policies for your content
Expose your data to AI agents via authenticated endpoints
## Available Metrics
### Total Calls
The total number of API calls and content access requests to your content.
### Average Response Time
The average time it takes to process and respond to requests.
### Total Input Tokens
The total number of tokens sent in all requests.
### Total Output Tokens
The total number of tokens returned in all responses.
### Average Input Tokens
The average number of input tokens per request.
### Average Output Tokens
The average number of output tokens per response.
### Content and Resources Access Over Time
A timeline chart showing how your content and resources are accessed over time.
## Next Steps
Configure access policies for your content
Expose your data to AI agents via authenticated endpoints